Pipeline velocity stands as the life-blood metric among digital marketing KPIs. It measures how fast qualified leads move through your sales pipeline to become closed deals. This powerful metric shows how well your marketing and sales efforts turn chances into revenue by combining multiple factors.

10 Must-Track Marketing KPIs That Actually Drive Growth in 2025
Published by abraham • October 28, 2025
Marketing teams face a significant challenge today – 34.2% of marketers rarely or never measure their digital marketing metrics‘ return on investment. This disconnect reveals a deeper problem in the industry.
Organizations track metrics that don’t matter. Nearly 39% of their tracked metrics focus on campaign delivery and digital vanity numbers instead of real business results. Marketing teams achieve better results when they align KPIs with their company’s specific goals and market position. A balanced scorecard method gives marketing teams a well-laid-out view of sales and marketing results. The digital world has evolved significantly in 2025. Teams now focus on engaged sessions and other digital marketing metrics that show real audience connections.
This piece reveals 10 essential KPIs that accelerate growth. Marketing teams can look beyond basic measurements to find metrics that predict success, maintain accountability, and lead to smarter decisions.

Pipeline velocity shows how quickly deals move through your sales funnel and create actual revenue. Many standard digital marketing metrics just track user participation. But pipeline velocity gives you a detailed view of your revenue generation efficiency. It measures how fast potential value turns into real income.
The formula combines four critical components:
- Number of opportunities in your pipeline
- Average deal value
- Win rate percentage
- Length of sales cycle
These elements come together in the equation: Pipeline Velocity = (Number of Opportunities × Average Deal Value × Win Rate) ÷ Length of Sales Cycle. The result shows a daily dollar amount that indicates your pipeline’s revenue generation.
Companies that keep track of pipeline velocity metrics see 28% higher revenue growth than those that don’t. Yet only 24% of sales teams track this vital metric. This creates a huge chance for businesses that want to speed up their growth.
Pipeline velocity helps predict future performance. Most performance marketing metrics tell you about past results. But velocity helps forecast what comes next, which lets you manage sales outcomes better. Companies with optimized pipeline velocity get more predictable revenue streams and steady flow through each funnel stage.
Pipeline velocity also spots bottlenecks in your conversion process right away. Slower velocity might show prospects getting stuck at certain stages, like contract talks or proposal reviews. Marketing teams can speed up deals by finding these friction points.
Sales and marketing teams that share this metric naturally line up their goals and cooperate to fix problems. This team approach means everyone pushes toward the same goal – making the customer’s experience faster.
You should split your pipeline into market segments (small, mid-market, enterprise) to calculate pipeline velocity accurately. Different customer types usually have unique sales cycle patterns, so this split gives better analysis.
Track pipeline velocity monthly or quarterly. This gives you enough data to spot real trends and time to make changes and measure results. Look at each part of the formula when checking results. If pipeline velocity drops, break down whether you have too few opportunities, lower win rates, smaller deals, or longer sales cycles.
Modern CRM systems track the needed data points automatically. Your pipeline velocity metrics’ accuracy depends on good data quality. Keep your CRM records up to date with qualified opportunities, deal sizes, and sales cycle lengths.
To get better insights, track these metrics along with simple pipeline velocity:
- Stage-to-stage conversion rates
- Pipeline velocity by representative
- Content and messaging effectiveness in closing deals
- Velocity trends across different market segments
Regular monitoring helps you spot seasonal patterns. Teams can tell normal changes from real problems that need fixing.
Customer Acquisition Cost (CAC) is an important financial measure that skilled marketers pay close attention to. With tighter control over marketing budgets nowadays, it becomes essential to understand how much your company invests to gain every new customer to achieve steady growth.

CAC measures what a business spends to get a new customer. This complete metric covers all costs related to sales, marketing, and other activities that help attract and convert potential customers into paying ones. It can further provide you access to understanding your companies efficiency and expenses such as:
- Marketing efforts like online ads social platforms, and email outreach
- Paying sales teams through salaries and commissions
- Using CRM tools and other software for sales
- Offers or discounts to attract buyers
This measure tracks how your marketing and sales approaches convert potential customers into actual ones. When CAC is lower, it means your business is gaining customers at a reasonable cost, which improves profits and supports long-term growth.
CAC ranks among the most important performance marketing metrics because it directly affects business sustainability and profits. Research shows that after product/market fit issues, businesses fail most often because they spend more on getting customers than they can earn from them.
The metric helps allocate budgets smartly. Marketing teams can distribute resources better when they know which channels and strategies are most affordable for getting customers. This optimization creates chances for faster growth.
A strong conversion rate shows that your message connects with your audience and drives them to act. This figure helps calculate your Customer Acquisition Cost (CAC) by revealing how your marketing spend brings in new customers.
Most importantly, CAC creates a vital link with Customer Lifetime Value (CLV). Businesses need CLV to exceed CAC for sustainable growth. A common standard aims for an LTV to CAC ratio of at least 3:1 – you should earn three dollars for every dollar spent getting a customer. Growth becomes financially unstable without this balance.
One way to calculate CAC is: CAC = Total Costs to Acquire Customers / Number of New Customers Acquired.
Despite this companies often make these mistakes when calculating their CAC:
- Missing some marketing and sales expenses
- Not considering specific time frames
- Leaving out customer retention costs
Companies looking to reduce their CAC and speed up growth can try several proven strategies:
- Value-based pricing works really well. Setting prices based on what customers think is valuable rather than production costs usually creates better acquisition economics. This strategy matches pricing with actual benefits customers receive.
- Using digital marketing channels—especially social media marketing, search engine marketing, and content marketing—can substantially reduce CAC. Studies show that better advertising campaigns and targeting the right audience through affordable channels directly lower acquisition costs.
- Referral programs make use of word-of-mouth marketing by getting existing customers to refer new prospects. This approach often costs less because referred customers typically convert better.
Sales processes that work smoothly and marketing initiatives that support sales team efforts improve overall efficiency. This arrangement helps marketing generate quality leads that convert more easily, which lowers the resources needed per acquisition.
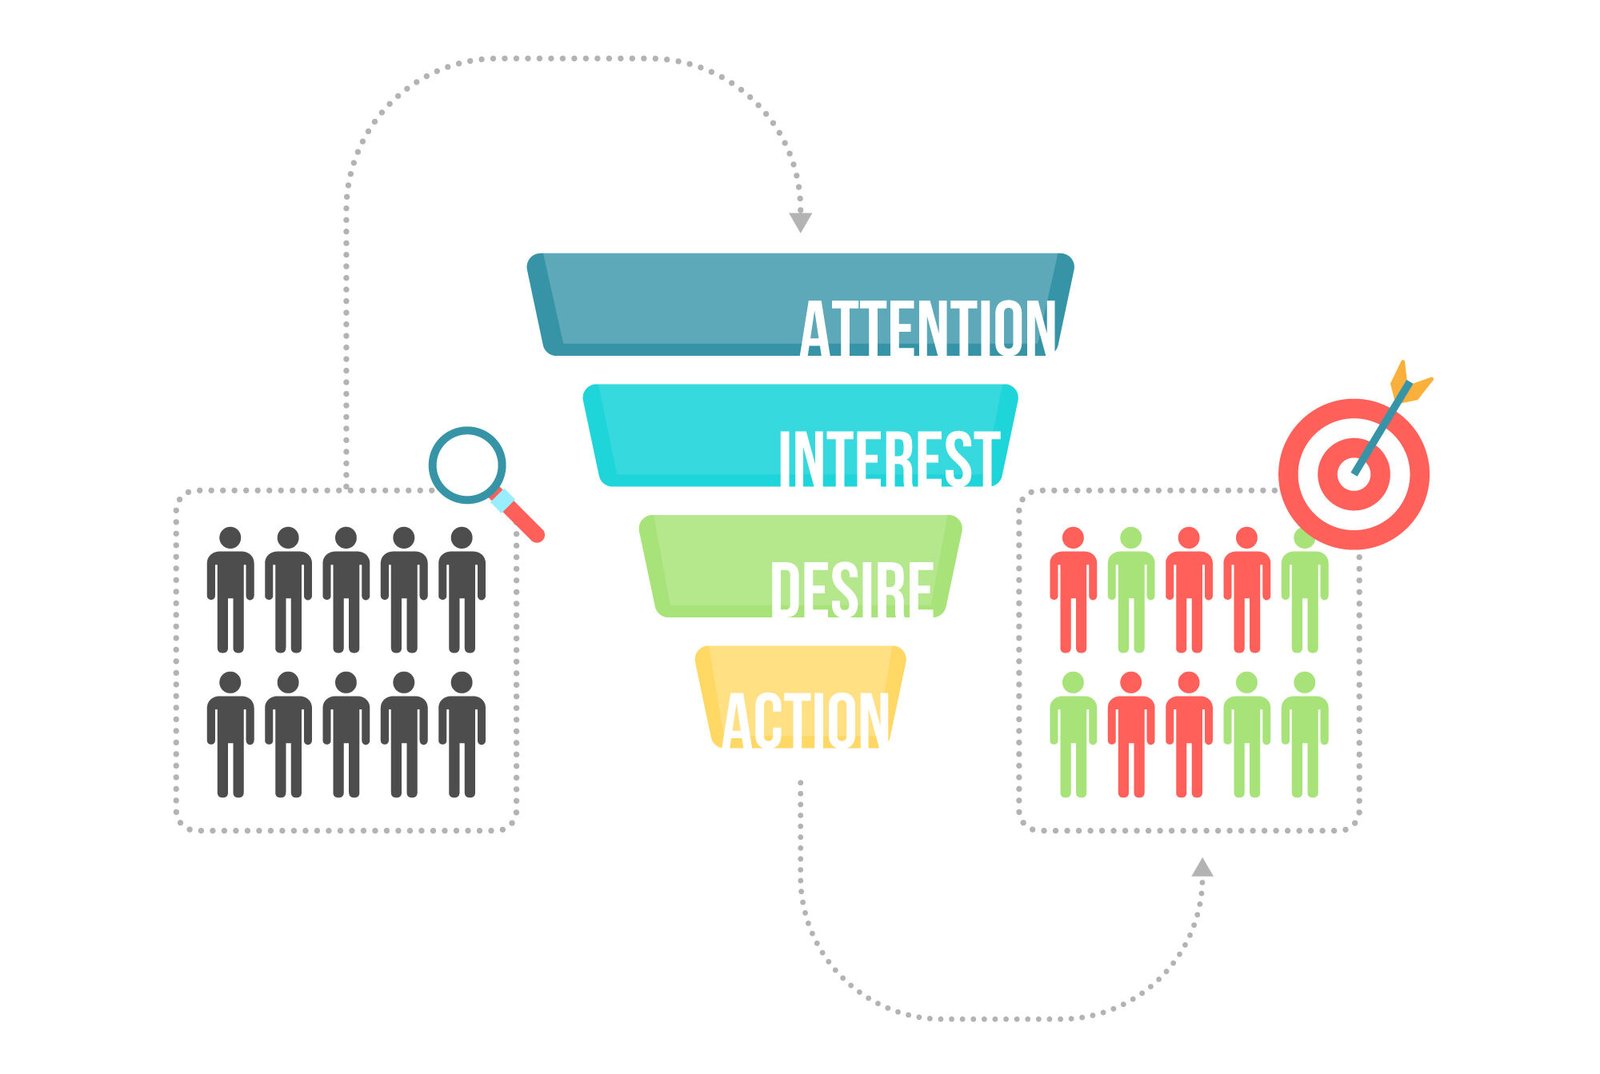
Conversion rate stands out as a key digital marketing metric that shows how well your marketing turns interest into action. This number reveals your customer acquisition funnel’s health and tells you how well your marketing works.

The conversion rate shows what percentage of website visitors complete a desired action. These actions depend on business goals – from ad clicks and form submissions to purchases and subscriptions. Companies will often use this metric to examine their campaigns success.
Your conversion rate has a direct effect on revenue growth. Small improvements can make a big difference – moving from 2% to 2.5% can boost monthly revenue by 25% without needing more traffic.
Your conversion rates help spot problems in your customer’s experience. When you see where potential customers drop off, you can fix specific issues in your message, design, or features.
Here are some effective ways to increase conversion rates:
- Easy-to-use design: Keep your website simplistic and easy to navigate, optimize it for mobile devices, improve loading speed, and include attention-grabbing visuals. A clean and well-thought-out design helps visitors take action more .
- Testing different options: Experiment with various headlines, pictures, call-to-action buttons, and layouts to learn what your audience likes most. Successful businesses use testing to improve their marketing and website performance.
- Simplified steps: Reduce the number of required form fields, offer social media login options, and let users see their progress . Complicated sign-up processes often turn people away.
- Use better calls-to-action: Make sure users can spot them . Add action verbs and spread them across your site to guide users . Clear and strong CTAs help visitors take the next move.
- AI tools make work smarter: They can customize content, manage leads, and tweak campaigns . Teams using AI noticed improvements, with 83% experiencing revenue growth last year, while 66% of non-AI teams had the same results.
- Track conversion rates: Doing this shows how well your site is performing and highlights areas to work on. By refining , you could double your ad value without having to pay extra for traffic.
One-time metrics only show temporary success, but Customer Lifetime Value (CLV) gives marketers a complete economic view of customer relationships. CLV stands as the life-blood of performance marketing metrics and shows the real effect of your acquisition and retention efforts.

CLV calculates how much total profit a company can make from a customer over their relationship. It looks past individual purchases and takes into account the entire customer journey to measure their full value to the business.
A basic CLV formula you can use contains using three main parts in a simple calculation: CLV = (How Much They Spend on Average × How Often They Buy) × How Long They Stick Around.
Where:
- The Average Purchase Value is the Total Revenue Divided by the Total Number of Purchases.
- Buying frequency equals the total purchases divided by the count of distinct customers.
- Typical customer lifespan means the average number of years a customer keeps buying products.
Today’s economic climate has pushed 67% of brands to move their focus from acquisition to retention. This makes sense since getting new customers costs five times more than selling to existing ones.
CLV serves as a guide and blueprint to adopt green practices. It provides a clearer picture of long-term customer relationships making future revenue easier to predict. This measurement also allows better allocation of resources helping companies identify valuable customer groups and design focused marketing strategies.
CLV helps set vital standards too. Successful digital business models want CLV-to-CAC ratios between 2:1 and 8:1. Without this balance, growth becomes financially unstable despite impressive acquisition numbers.
Companies can track CLV at different levels. The descriptive model uses past data to calculate simple CLV. Predictive models analyze patterns to forecast future value. The operative model uses machine learning to predict CLVs and make recommendations automatically.
Your CLV will grow with these proven strategies:
- Make customer support exceptional: Turn it from reactive responses into relationship building by combining customer data from all touchpoints.
- Make marketing personal: Make strategies and recommendations based upon an individuals previous purchases.
- Start loyalty programs: These programs work well, with 80% of companies seeing positive ROI—making 4.9 times more revenue than costs.
- Create profit-based segments: Group your customers based upon their past spending habits and change your strategies for each group.
Regular updates to data and calculations remain vital when tracking CLV. A well-implemented CLV becomes more than just another marketing metric—it becomes your strategic guide for long-term business decisions.
Marketing Qualified Leads (MQLs) link marketing activities to sales outcomes. They serve as an important measure and require close focus in any thorough system for measuring performance.

Marketing Qualified Leads are people who show interest in a product or service by engaging with marketing materials. These leads act from regular ones because they are more likely to make a purchase. They may perform actions such as downloading resources, signing up for webinars visiting pricing pages, or requesting additional details.
MQLs fall in the middle stage between just being interested and being ready to buy in the customer journey. Marketing teams figure out which leads need more attention before the sales team steps in. The process is simple. Leads become MQLs then Sales Qualified Leads (SQLs), and turn into buyers.
This metric shows whether marketing and sales teams align on what qualifies as a good prospect. It also reveals how leads transition from marketing to sales.
The numbers tell a surprising story. Roughly 90% of MQLs never convert to SQLs. This shows we need better lead qualification processes. Research also shows that 98% of MQLs never turn into actual business sales. That’s why many companies now care more about lead quality than quantity.
B2B companies now focus on creating better MQLs that turn into opportunities more often. This approach works better than just getting lots of leads. When leads match ideal customer profiles, they convert at much higher rates.
In order to properly create quality MQLs both the sales and marketing teams need to collaborate. A good place to start the process is by making detailed ideal customer profiles and buyer personas. These should cover demographics, company info, challenges, and actions that indicate a prospect is ready to buy.
Businesses can implement lead scoring methods by looking at:
- Job titles, industries, and company sizes
- Actions like downloading content visiting websites, or interacting with emails
- Explicit actions (requesting demos, using pricing calculators)
MQL tracking needs these key practices:
- Marketing and sales teams should use the same definitions
- Clear acceptance criteria with SLAs for sales team responses must exist
- Track both volume and quality metrics, including created MQLs, accepted MQLs, conversion percentages, and velocity
- Use proper identification through Person/Account IDs, Offer IDs, and Campaign IDs
Companies should review and update their MQL definitions every quarter to match changing business needs. This modification and tuning will help the pipeline flow smoothly, and revenue grow effectively.
Marketing professionals face growing pressure to show financial accountability for their work. Return on Marketing Investment (ROMI) stands out as a direct way to measure marketing’s profitability.

ROMI shows the financial value of marketing initiatives compared to their cost. The metric calculates net revenue from marketing activities divided by marketing investment. ROMI differs from traditional ROI by focusing only on marketing expenses. This helps companies learn about how well these investments propel development.
Companies can calculate ROMI in several ways:
- Total ROMI: Return on all marketing spending
- Incremental ROMI: Return on additional spending for specific campaigns
- Marginal ROMI: Return on the “last dollar” spent
This metric works as a control mechanism and predicts future cash flows. It gives explanations that other digital marketing metrics cannot provide.
ROMI links marketing actions to financial results directly. Marketing leaders in North America call it very useful, yet only 49% use it actively in their business.
ROMI is not just about keeping track of accountability. Marketing teams rely on it to measure efficiency allocate budgets, and divide resources among different brands or channels. It also helps teams figure out if individual campaigns are likely to succeed. This metric turns marketing from just an expense into an investment with measurable returns.
You can calculate ROMI using a simple formula: (Sales Growth – Marketing Cost) × 100 / Marketing Investment.
How people react to marketing doesn’t happen in a simple way. Studies show it follows a pattern where the first money spent brings bigger rewards compared to what is earned from spending more later. Businesses shouldn’t compare the return on marketing investment across campaigns unless they use equal budgets for each one.
Ways to improve ROMI include:
- Setting clear KPIs that show both performance outcomes and spending efficiency
- Using complete benchmarking against industry standards
- Balancing short-term results with long-term brand building
Smart marketers use ROMI among other performance marketing metrics.
Smart marketers understand that hearing from customers shows how a business is growing. It offers much more than looking at sales numbers or tracking progress stats alone. Net Promoter Score also called NPS, is among the key tools to measure how well businesses perform. It is straightforward but useful. It helps companies see what their customers truly feel.

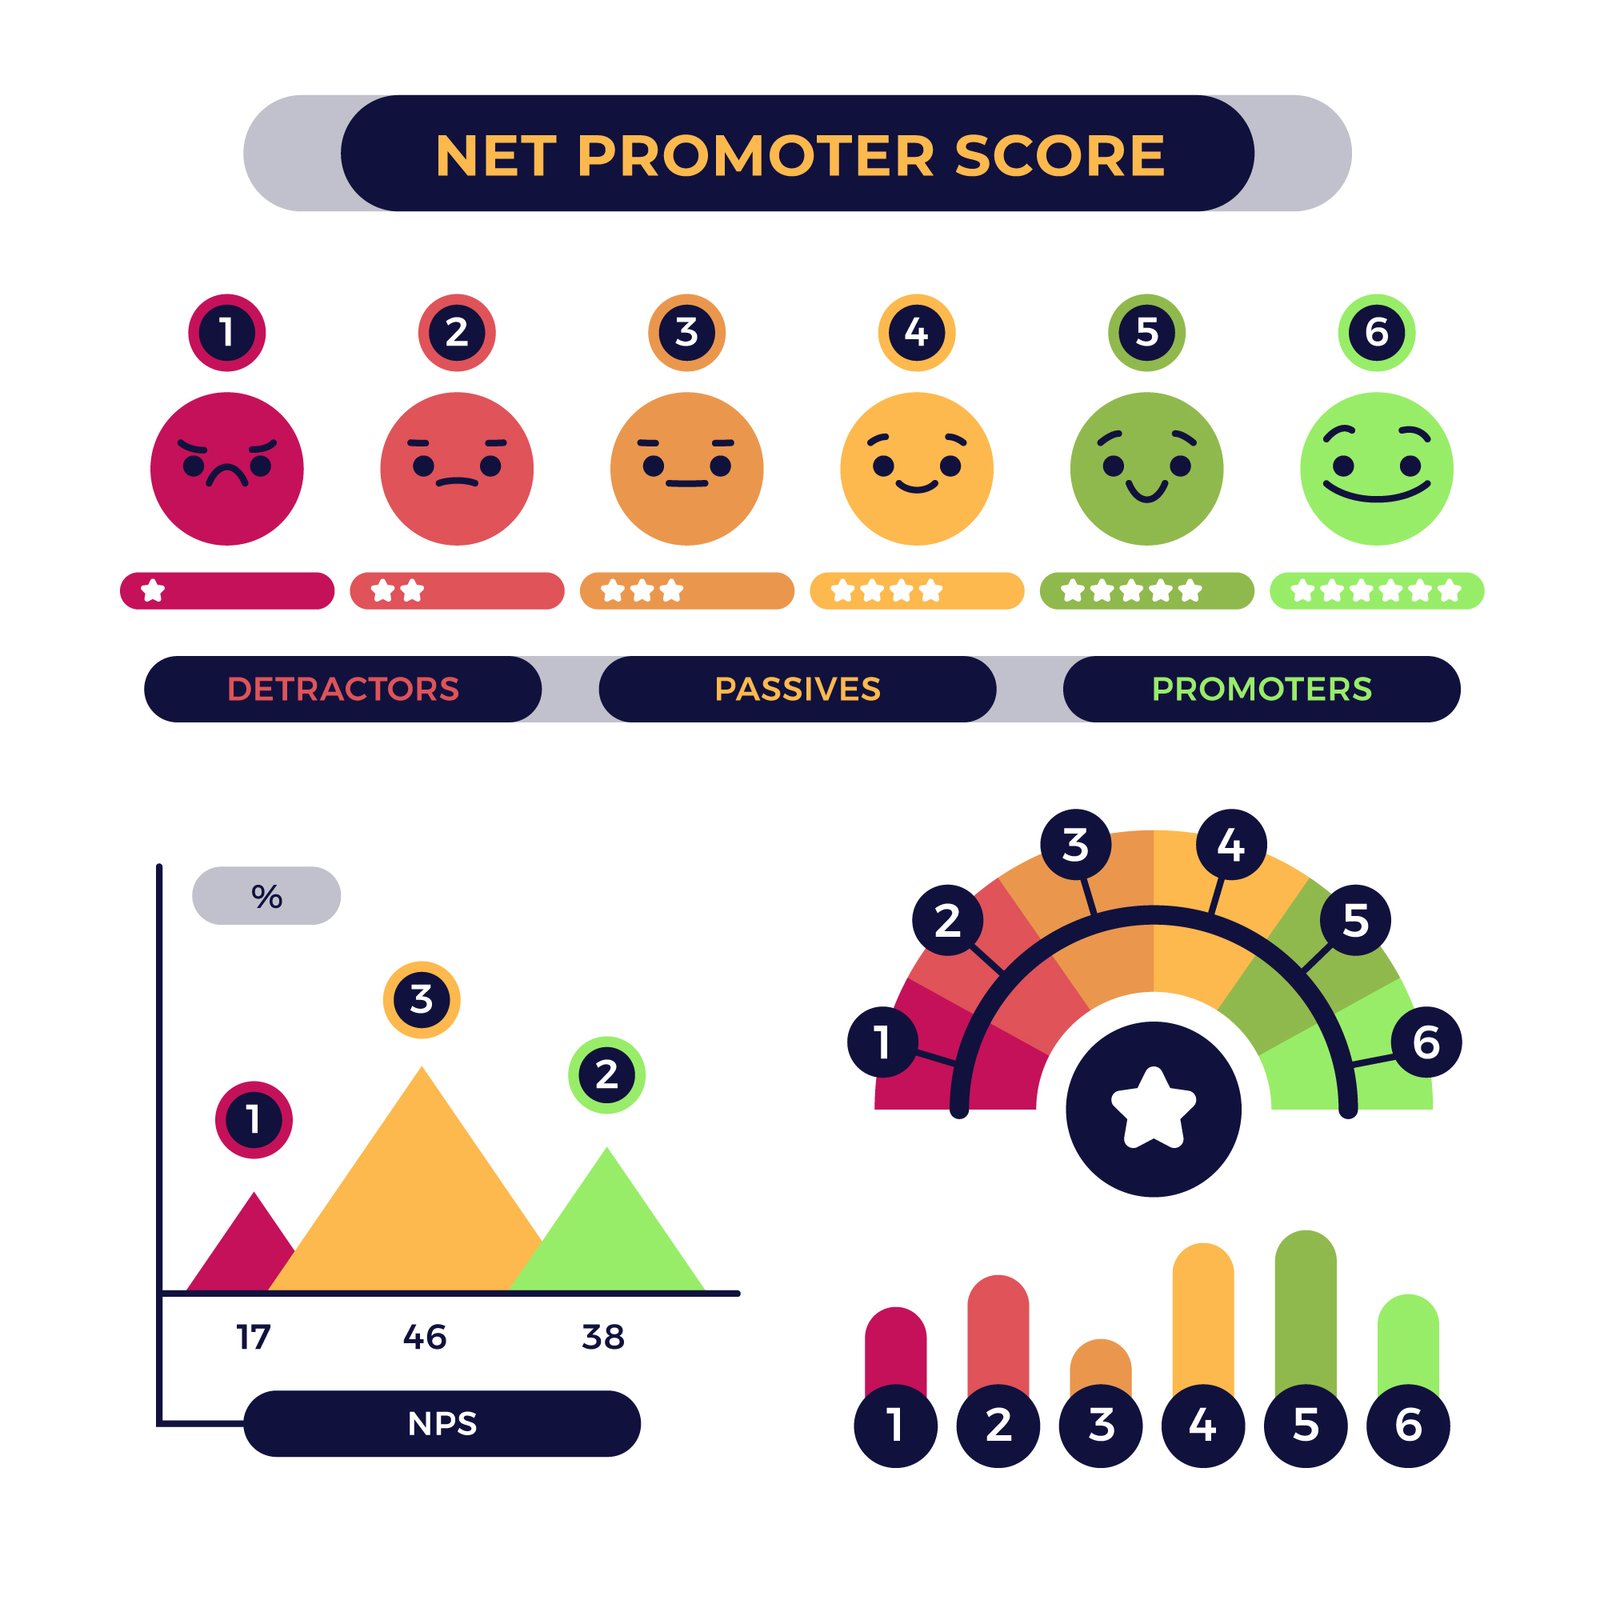
Net promoter score measures how loyal a customer is based upon how they would rate your company or product on a ten point scale. It has long been used to understand and think about a customers experience.
The scores split survey answers into three groups:
- Promoters scoring 9-10, are loyal fans who continue purchasing and recommend your brand to others.
- Passives scoring 7-8, are happy with your product but not excited.
- Detractors scoring 0-6, are those unhappy customers who could hurt your brand’s reputation.
NPS reliably indicates customer loyalty because it predicts future behavior. Research by Bain & Company shows a strong link between relative Net Promoter Scores and growth rates. Companies leading their industry in NPS typically grow twice as fast as their competitors.
This metric works on multiple levels. It shows the overall customer experience clearly. Companies can also compare their performance against competitors, since different industries have their own standards – grocery stores average 30, video streaming services 29, while consumer payments sit at -6.
Companies need strategic action to turn NPS from a measurement into real growth. Here’s what organizations should do:
- Follow up with customers through interviews or emails to understand their scores better
- Reach out to unhappy customers first and fix their concerns to rebuild relationships
- Create teams across departments to review scores, plan improvements, and track progress
Company leaders should champion NPS openly and show how scores affect company reviews. Through paying attention to the feedback of your customers your company can avoid detractors and focus on the right items.
Marketing teams rely on solid tools to find out what succeeds and what fails. Cost per Lead (CPL) plays a major role by showing businesses how their marketing spending brings in potential buyers.

Cost per Lead shows how much money a company spends on marketing campaigns to get a new lead or potential customer. This metric shows how well a company generates leads through different marketing channels to find the best strategies. The math is simple: CPL = Marketing Campaign Spend ÷ Number of New Leads. To cite an instance, see a company that puts $10,000 into social media ads and gets 200 new leads – their CPL comes to $50.
CPL acts as a key indicator of how well businesses build their sales pipeline. Lower CPL means better use of marketing money, which creates room to grow or try new channels. Companies use CPL data to make smart choices about where to put their resources by finding the most affordable marketing methods. Different industries see different results – legal services’ leads cost around $649, while eCommerce businesses typically pay $91 per lead.
Businesses can lower their CPL and maintain good lead quality through these effective methods:
- Improved targeting: Analyze data like demographics, interests, and behavior to identify audience segments most likely to take action
- Enhanced landing pages: Speed up pages, improve design, and match them with ad messages to increase conversions
- Frequent testing: Try out various ad visuals, headlines, content, and CTAs to discover what grabs the target audience the best
Smart marketers closely monitor Sales Cycle Length as a vital time-based performance indicator for successful deal management. This metric shows how well operations run and affects financial results in marketing and sales.

Sales cycle length measures how long it takes to close a deal from the first contact with a prospect. This metric started as a repeatable, tactical process and changes by a lot based on several factors. B2B sales cycles usually take about 4 months. Harvard University found that more than 25% of sales cycles need 7 months or longer. The cycle length changes based on how complex the product is, its price, target audience, and the number of people making decisions.
Shorter sales cycles create amazing financial effects through faster cash flow. Studies show that cutting a sales cycle makes annual recurring revenue (ARR) jump 46% over two years. The results get better when you reduce it to two months – ARR soars 143% compared to four-month cycles. Companies can reinvest cash more often to get new customers, which creates a snowball effect.
You can calculate sales cycle length by adding all days needed to close each sale and dividing by total deals. The quickest way to improve includes:
- Set up clear sales methods so your sales team controls the process
- Talk about pricing early so you don’t waste time with prospects who can’t afford your solution
- Make your lead qualification better to focus on the right prospects
- Make internal processes smoother by cutting unnecessary steps and making handoffs clear
Note that you need consistent CRM data to track accurately and keep improving.
Account Engagement Score stands out as a combined metric that shows the total activities from everyone interacting with your company at the account level. This score gives you a unified view of how entire organizations engage with your products or services, rather than focusing on individual metrics.

The Account Engagement Score shows how interested an organization is in what you offer rated from 0 to 100. The score includes various interactions. It factors in visits to specific website pages, downloads of content, form fills, email responses, and attendance at events. Recent actions matter more because time decay adds weight to them making the score better represent current engagement habits.
The B2B sales cycles involves the decisions of multiple stakeholders in purchasing decisions. The Account Engagement Score helps you spot which target companies show real interest across their buying committee. Companies that track account-level engagement can prevent their team members from accidentally reaching out to different contacts at the same company. This improved coordination leads to better lead nurturing and more targeted campaigns.
The right marketing KPIs turn simple data collection into a powerful engine of growth. Many marketers still focus on vanity metrics. This piece shows how changing focus to ten crucial KPIs builds a foundation for business growth and meaningful ROI.
These metrics each have a specific role and work as a team in a connected system. Pipeline Velocity helps predict how well things might go in the future. Customer Acquisition Cost checks if gaining each customer is profitable. Conversion Rate shows how effective marketing is. Customer Lifetime Value looks at what a customer brings over time. Marketing Qualified Leads help link marketing work to sales outcomes. Return on Marketing Investment highlights the direct effect of marketing on finances.
Net Promoter Score helps collect customer feedback in a useful way. Cost per Lead shows how well businesses bring in leads, while Sales Cycle Length reflects how operations run. Account Engagement Score gives a detailed view of B2B customer interest across different parts of a company.
Experienced marketers understand these metrics work more when combined rather than when used alone. Since these metrics are connected, they provide a clearer picture of how marketing performs during a customer’s journey. Companies that master these key performance indicators gain an advantage by using resources , making smarter choices, and growing more .